
The President of the ECB is confident in his ability to stare down deflation risk and bring the inflation rate up to its official target of 2%…on a 2016 horizon. Well that was reassuring; the euro celebrated the news by increasing to USD 1.386 this morning, a record since October 2011! Could we have expected anything different? Apparently not. The ECB wasn’t about to shoot itself in the foot by announcing that its forecast pointed to a deflationary scenario, tacitly recognizing that it would fail in its deflation battle.
Archives par catégories : Inflation
Global Inflation – Disinflation Is Gaining Ground Across the Globe
At the global level, disinflation is gaining ground. After a temporary rebound during spring, global inflation continued its downtrend in the second half of 2013 and ended the year at 3.2%. Inflation remains very weak in the developed world, at 1.3% in December, and has also sagged in many emerging markets in recent months, to finish 2013 at 6.1%.
In fact, as of December 2013, nearly half the countries (39) in our sample of 80 countries had inflation rates of less than 2%, which is markedly higher than a year ago (24). These figures have seen the addition of a growing number of Asian economies (6), the United States and Canada as well as all 27 members of the EU – without exception. Moreover, the number of countries with moderate inflation (3-4%) decreased sharply while the proportion of high-inflation economies (>6%) has not changed considerably and includes African countries and conflict-plagued countries for the most part.
- Disinflation Is Gaining Ground Across the Globe
- Commodity Prices Easing
- Price Picture Still Mixed in EMs
- Deflation Risk Remains High in the West
- United States, Not Quite in the Clear Yet
- Euro Area, Deflation Risk Spreading to Core
- Imports, an Additional Source of Disinflation
- Increase in Real Interest Rates, the Bigger Threat
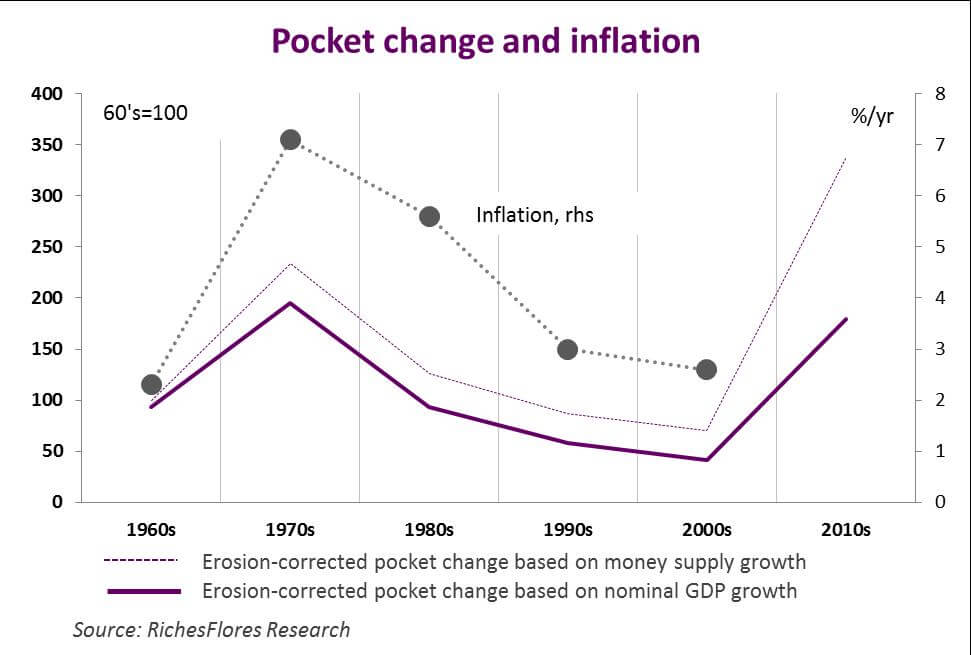
What Pocket Change Can Tell Us About Past -and Future- Inflation
When you get back from an overseas vacation, you’re often left with a bunch of small foreign coins in your pocket. You typically end up stashing them away in a junk drawer as soon as you get home, and this is precisely what I was in the process of doing after a recent trip to the U.S. when a penny dated 1964 caught my eye. I then looked more closely at the dates on my assorted pennies, dimes, nickels, and quarters. I even added my daughter’s coins to the mix. Soon intrigued by this journey back through time, we decided to group the coins by decade. What we found was startling: out of the 107 pennies left from our trip this summer, 3 were from the 1960s, 12 from the 1970s, and 11 from the 1980s. In other words, 24 percent of our lowest denomination coins came from years of double-digit inflation—when the coin mints apparently ran non-stop.
But what about the ensuing decades? Could we see the effects of the subsequent disinflation in our sample, given that our sample is necessarily biased by the lesser erosion in the supply of recently-minted coins? We had 13 coins from the 1990s and 18 from the 2000s. How could we possibly prove that once the time factor is taken into account, this is a much smaller proportion of coins relative to that from the inflationary decades? It seemed a hard circle to square. We were about to give up when we found some coins we had overlooked—our group from 2010 to 2013. There were many more of these, of course: 50 for a period of only 3.5 years—the equivalent of 142 coins per decade!
This shed an entirely new light on our figures. We realized that since we may safely assume the rate of erosion remains pretty much the same from one decade to the next, we can estimate the “erosion-corrected” size of a group of coins from a given decade by “reverse discounting” its actual size by an erosion factor. So we found a pen and did some back-of-the-envelope calculations. First we used an annual erosion rate of 5.5 percent, which was the growth rate of the M1 money supply in the U.S. over the period we were looking at. Next we used an annual erosion rate of 6.7 percent, which was the average annual growth rate of U.S. GDP over the same period. As it turned out, 6.7 percent was closer to what our pocket-change sample suggested.
Theoretically, this gave us a comparable, erosion-corrected total number of coins for each decade. When we restated our results using a base value of 100 for the 1960s batch, we found:
- The erosion-corrected total peaked in the 1970s, at 234 using the 5.5 percent erosion rate and 209 using the 6.7 percent erosion rate;
- The total then decreased steadily and hit a low, in the 2000s, of 70 at the 5.5 percent erosion rate and 45 at the 6.7 percent erosion rate;
- The total rebounded sharply for our very last group of coins, those from 2010–2013, reaching a new high of 318 at the 5.5 percent erosion rate and coming in just below the 1970s value at the 6.7 percent erosion rate.
As you may have guessed, we couldn’t resist plotting our results alongside inflation for the same decades. Unsurprisingly, the curves matched up beautifully.
So what’s the moral of the story? Given the pace at which the amount of money in circulation has been growing since 2010, the U.S. appears on track for high inflation once it pulls out of the crisis. And we stand by our prediction even though the process seems to be taking longer than expected. An era of rising prices is already a palpable prospect.
Global Inflation
The Gold Selloff as Warning Sign for Impending Deflation
Recent disappointment with a sluggish economy has altered perceptions about the risk of inflation. Since the beginning of March, ten-year inflation expectations in the U.S. bond market have shed 30 basis points, the sharpest decline in the past year. At the same time, plummeting gold prices bear witness to growing doubts about the reflationary policies pursued by central banks. Moreover, current global trends suggest that this sentiment won’t be changing any time soon:
- With inflation rates well below 2 percent and still receding, most industrialized countries are inching their way toward deflationary territory. High unemployment and low capacity utilization rates exert strong downward pressure on wages and producer prices, a trend accentuated by softer energy prices.
- The rising inflation observed in an increasing number of emerging economies is in fact limited to those with little global influence, primarily India, Russia, Brazil, and Argentina. Asia’s exporters of manufactured goods still show low inflation rates that are much closer to those in the advanced countries.
All these developments should therefore encourage central banks the world over to go further with monetary easing.