The Fed Plays for Time—Predictably

Download

“The first increases in short-term rates might not occur until the unemployment rate is considerably below 6.5 percent”!  Ben Bernanke, Sept. 18, 2013

The Fed has dared to act contrary to expectations—and rightly so. This was no easy move, given that since early summer the markets have talked themselves into believing that central bank policy was about to change. Yet the reasoning behind the FOMC decision couldn’t be clearer:

  1. The U.S. economy is still on extremely shaky ground. Growth has yet to pick up; job gains remain mediocre; disposable income is still too low to drive a lasting recovery in consumer spending; and businesses are not investing.
  2. Yields have risen so sharply since the start of the summer that they have come to pose a threat to growth, as demonstrated by the sudden halt to the housing market uptick since the spring.
  3. The lower jobless rate doesn’t reflect improvement in labor market conditions. If anything, it shows that they have continued to get worse. The labor force participation rate is in free-fall—in other words, more and more working-age people are simply dropping out in discouragement.
  4. Fiscal policy is highly restrictive and will remain so—just when implementation of health-care reform prior to year-end is likely to take a large bite out of personal income.

Today’s announcement has major implications

The U.S. Economy: Far Too Early to Break Out the Champagne

Download the article

That markets are wildly optimistic about the U.S. economy is nothing new. What should draw our attention this time around is that such upbeat sentiment has rarely been harder to square with the numbers. For example, contrary to the dominant narrative:

  • The U.S. economy is doing worse than a few months ago, not better. Growth in industrial output is petering out, productivity has moved into negative territory, and employment data point to backsliding.
  • The economy’s ability to cope with higher interest rates simply can’t be taken for granted. Not only has consumer spending yet to pick up, but the real estate market has been derailed by the rise in interest rates since the start of the year.
  • While a change of course by the Federal Reserve may seem long overdue after five years of unconventional monetary policy, it makes no economic sense. This suggests that the Fed is very much in danger of jumping the gun.

What Pocket Change Can Tell Us About Past -and Future- Inflation

Download

When you get back from an overseas vacation, you’re often left with a bunch of small foreign coins in your pocket. You typically end up stashing them away in a junk drawer as soon as you get home, and this is precisely what I was in the process of doing after a recent trip to the U.S. when a penny dated 1964 caught my eye. I then looked more closely at the dates on my assorted pennies, dimes, nickels, and quarters. I even added my daughter’s coins to the mix. Soon intrigued by this journey back through time, we decided to group the coins by decade. What we found was startling: out of the 107 pennies left from our trip this summer, 3 were from the 1960s, 12 from the 1970s, and 11 from the 1980s. In other words, 24 percent of our lowest denomination coins came from years of double-digit inflation—when the coin mints apparently ran non-stop.

But what about the ensuing decades? Could we see the effects of the subsequent disinflation in our sample, given that our sample is necessarily biased by the lesser erosion in the supply of recently-minted coins? We had 13 coins from the 1990s and 18 from the 2000s. How could we possibly prove that once the time factor is taken into account, this is a much smaller proportion of coins relative to that from the inflationary decades? It seemed a hard circle to square. We were about to give up when we found some coins we had overlooked—our group from 2010 to 2013. There were many more of these, of course: 50 for a period of only 3.5 years—the equivalent of 142 coins per decade!

This shed an entirely new light on our figures. We realized that since we may safely assume the rate of erosion remains pretty much the same from one decade to the next, we can estimate the “erosion-corrected” size of a group of coins from a given decade by “reverse discounting” its actual size by an erosion factor. So we found a pen and did some back-of-the-envelope calculations. First we used an annual erosion rate of 5.5 percent, which was the growth rate of the M1 money supply in the U.S. over the period we were looking at. Next we used an annual erosion rate of 6.7 percent, which was the average annual growth rate of U.S. GDP over the same period. As it turned out, 6.7 percent was closer to what our pocket-change sample suggested.

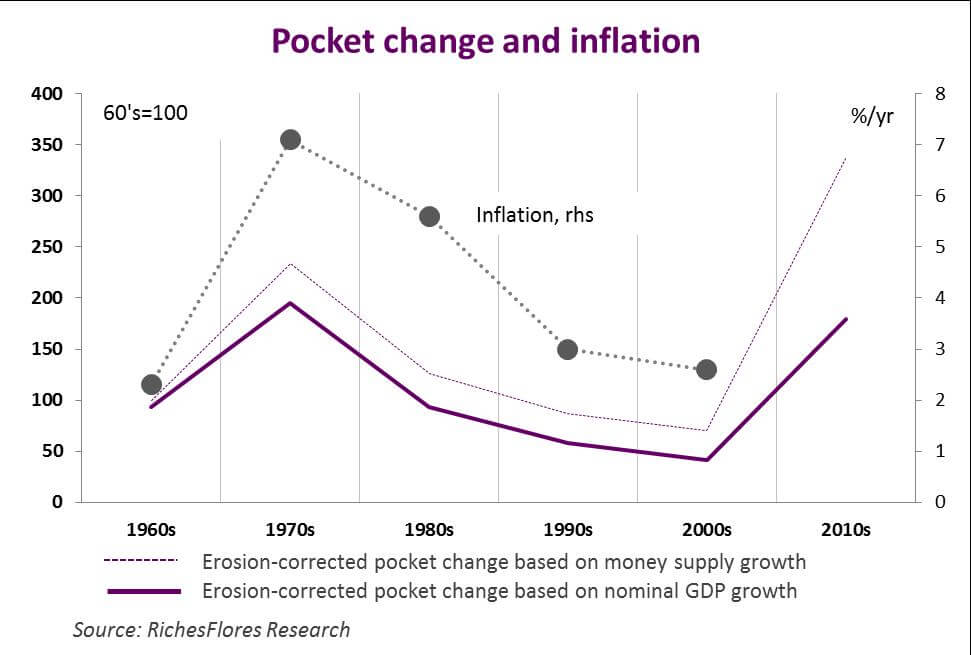
Theoretically, this gave us a comparable, erosion-corrected total number of coins for each decade. When we restated our results using a base value of 100 for the 1960s batch, we found:

  • The erosion-corrected total peaked in the 1970s, at 234 using the 5.5 percent erosion rate and 209 using the 6.7 percent erosion rate;
  • The total then decreased steadily and hit a low, in the 2000s, of 70 at the 5.5 percent erosion rate and 45 at the 6.7 percent erosion rate;
  • The total rebounded sharply for our very last group of coins, those from 2010–2013, reaching a new high of 318 at the 5.5 percent erosion rate and coming in just below the 1970s value at the 6.7 percent erosion rate.

As you may have guessed, we couldn’t resist plotting our results alongside inflation for the same decades. Unsurprisingly, the curves matched up beautifully.

Pocket Money and Inflation


So what’s the moral of the story? Given the pace at which the amount of money in circulation has been growing since 2010, the U.S. appears on track for high inflation once it pulls out of the crisis. And we stand by our prediction even though the process seems to be taking longer than expected. An era of rising prices is already a palpable prospect.

The Upcoming Fed Meeting: Playing for Time

Download the article

Most pundits agree that the question isn’t if the Fed will taper off its liquidity injections, but by how much. And they hope to find answers in the minutes of the next FOMC meeting a month from now. It’s unlikely the Fed will backtrack from previous guidance; even that was enough to steer markets back in the right direction. Long-term interest rates are returning to more normal levels, and capital is starting to flow back into money-market funds. An about-face by the Fed at this point would be more likely to wreak havoc than anything else. However, a closer look reveals that the economic indicators predicating investors’ newfound optimism don’t actually point to a U.S. recovery (see below). Many of these indicators remain weak, signaling that the world’s largest economy isn’t strong enough yet for a return to regular interest rate levels.

Bernanke and the Fool’s Gold of Falling Unemployment

Download the article

The last time U.S. unemployment fell below the 6.5 percent mark, the country’s GDP was growing at an annual clip of about 3 percent, real household spending was rising at nearly 4 percent a year, monthly job creation was flirting with 300,000, and annual wage growth was just over 2.5 percent. That was back in March 1994, but similar conditions prevailed in March 1987 and in December 1977. Each time around, labor utilization and capacity utilization were close to potential output—making monetary tightening to one degree or another the right choice. And each time around, a cycle of higher interest rates duly ensued. But in 2003 and 2004, the economic climate was entirely different. Not only had the jobless rate been stuck below 6.5 percent for about a decade; there wasn’t a single blip on the radar screen to suggest that the economy might overheat. So it wasn’t until mid-2004, with unemployment hovering at around 5.5 percent, that the Fed initiated a rate-raising campaign. A good many pundits would later criticize this belated adjustment, identifying it as a major inflator of the now-infamous real estate bubble.

Image UNE anglais

Thus, when it came time a few months ago to provide forward guidance on monetary policy, the Fed understandably selected the 6.5 percent unemployment mark as a key criterion for when and how to taper its quantitative easing program.

Even so, this policy choice raises a whole host of questions. A given jobless rate may in fact reflect a much shakier economy today than it would have during previous, seemingly similar periods. 

How Effective is the Wealth Effect?

Download the article

The wealth effect—the increased consumer spending thought to result from rising financial and real estate asset prices—is frequently cited as a key argument for renewed faith in the U.S. economy today. That faith, however, may soon prove to be misguided, as we will attempt to show in this paper.

Economists use the term wealth effect in a very precise way: to explain how household savings patterns shift in response to changes in household net worth. When net worth goes up, due to an increase in the assessed value of homes or to rising stock prices, for example, people tend to set a smaller share of their wealth aside—in other words, their personal savings rate goes down, leaving more money for consumer spending. The term wealth effect basically refers to this higher consumption.

The wealth effect was particularly significant during the 2000s. It isn’t hard to demonstrate, for example, that in every year from 1998 to 2007, rising property values alone shaved as much as one percent off of the U.S. household savings rate. This made it possible for consumer spending to grow faster than disposable income, which had slowed as a result of weak job creation. For one thing, the perception of greater wealth created by rising asset prices tends to reassure households and boost consumer confidence in ways that encourage spending. For another, in countries with highly developed mortgage markets, increased net worth improves household balance sheets and enables homeowners to borrow more extensively. The macroeconomic benefits often produced by these factors would, of course, be particularly welcome in the United States today, since the Federal Reserve’s policies have turned out to be more effective in driving up assets prices than in stimulating the broader economy.

However, a number of problems are likely to prevent the wealth effect from operating as in the past:

  • The first, and by far the biggest one, is the current savings rate in the U.S. Because the processes described above don’t directly generate income, they can’t influence growth unless consumers dip into their savings. This means that the strength of the wealth effect depends to a large extent on how high the personal savings rate initially is. As it turns out, that rate was equal to just 2.5 percent of U.S. disposable income in April, leaving very little room, if any, for a further decrease.
  • The second problem hinges on how much debt American households already carry and on whether paper wealth gains will enable them to borrow more. The answer is: they won’t unless those households can afford a higher debt ratio—a rather improbable scenario at this stage. To understand why, it is important to bear in mind the distinction between the household debt service and household debt ratios. Due to falling interest rates—which have allowed U.S. homeowners to refinance their mortgages—and to extensive debt cancellation brought about by the wave of foreclosures in recent years, debt service payments as a proportion of disposable income have plummeted. This decrease in the debt service ratio has made more money available to households and has therefore been a major contributor to the recovery in consumer spending over the past two years. But this process can’t rightfully be considered a wealth effect, and since it is already behind us, it is unlikely to be much of a stimulus to future consumption. The debt ratio, which measures the stock of household debt as a proportion of income, is the only reliable predictor of household borrowing capacity. Unfortunately, it has remained stubbornly high: barely 20 percent below its pre-crisis peak, and thus well above its long-term average. So there is probably very little scope for a substantial increase in U.S. household debt—which in any case would be a bizarre development right after a debt crisis of the kind we have just been through.

All this, along with low job creation numbers, should make it clear why we have more doubts than most on the prospects for buoyant consumer spending in the U.S.

Une_anglais

The U.S. Economy: Don’t Count Your Chickens Before They Hatch

Download the article

Sentiment on the U.S. economic outlook has gone from a flurry of uncertainty at the start of the year to renewed optimism. Admittedly, there are grounds for being bullish. Growth has held up despite tougher fiscal and tax policies; the housing market recovery has continued; and the Fed has stuck to its easy money policy. But let’s not get carried away! The latest numbers are no more encouraging than those available at the end of last year. In particular, decelerating productivity growth, with all that it implies in terms of profit, investment, and job trends in the next few quarters, may well drag the U.S. economy back down in the second half of the year. And with a policy mix that is less accommodative than before, the key ingredients for a genuine recovery are still nowhere to be seen. All this has conditioned our analysis on several points:

  • We wonder whether a change in monetary policy is on the short-term agenda—and worry that the Fed may withdraw its support too soon.
  • While we aren’t overly concerned about trends in the U.S. bond market and the euro’s exchange rate, we do suspect that the stock market will be more vulnerable to disappointing macroeconomic data.
  • We have very little faith in the American economy’s chances of regaining its status as powerhouse of the global economy before the year is out.

Global Inflation

Download the monitor

The Gold Selloff as Warning Sign for Impending Deflation

Recent disappointment with a sluggish economy has altered perceptions about the risk of inflation. Since the beginning of March, ten-year inflation expectations in the U.S. bond market have shed 30 basis points, the sharpest decline in the past year. At the same time, plummeting gold prices bear witness to growing doubts about the reflationary policies pursued by central banks. Moreover, current global trends suggest that this sentiment won’t be changing any time soon:

  • With inflation rates well below 2 percent and still receding, most industrialized countries are inching their way toward deflationary territory. High unemployment and low capacity utilization rates exert strong downward pressure on wages and producer prices, a trend accentuated by softer energy prices. 
  • The rising inflation observed in an increasing number of emerging economies is in fact limited to those with little global influence, primarily India, Russia, Brazil, and Argentina. Asia’s exporters of manufactured goods still show low inflation rates that are much closer to those in the advanced countries. 

 All these developments should therefore encourage central banks the world over to go further with monetary easing.