
The last time U.S. unemployment fell below the 6.5 percent mark, the country’s GDP was growing at an annual clip of about 3 percent, real household spending was rising at nearly 4 percent a year, monthly job creation was flirting with 300,000, and annual wage growth was just over 2.5 percent. That was back in March 1994, but similar conditions prevailed in March 1987 and in December 1977. Each time around, labor utilization and capacity utilization were close to potential output—making monetary tightening to one degree or another the right choice. And each time around, a cycle of higher interest rates duly ensued. But in 2003 and 2004, the economic climate was entirely different. Not only had the jobless rate been stuck below 6.5 percent for about a decade; there wasn’t a single blip on the radar screen to suggest that the economy might overheat. So it wasn’t until mid-2004, with unemployment hovering at around 5.5 percent, that the Fed initiated a rate-raising campaign. A good many pundits would later criticize this belated adjustment, identifying it as a major inflator of the now-infamous real estate bubble.
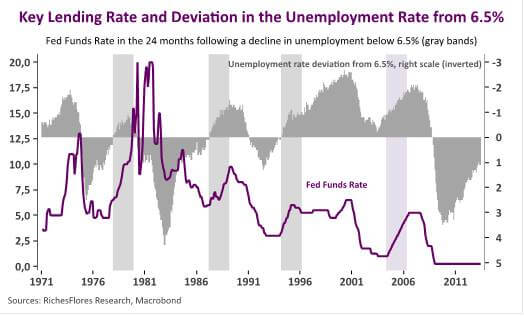
Thus, when it came time a few months ago to provide forward guidance on monetary policy, the Fed understandably selected the 6.5 percent unemployment mark as a key criterion for when and how to taper its quantitative easing program.
Even so, this policy choice raises a whole host of questions. A given jobless rate may in fact reflect a much shakier economy today than it would have during previous, seemingly similar periods.